GeoHealth Mapping GIS Training
for Monitoring and Evaluation or
Strategic Information Officers and Data Analysts for HIV

5.1. Examples of Programmatic Questions
In previous modules, we demonstrated how to carry out various analyses using QGIS. We also provided examples of programmatic questions that could be answered.
In this section, we offer users a 'cheat sheet,' or a consolidated list that aligns questions of interest with analytic approaches.
| Questions | Potential Methods |
|---|---|
| 1. Understand variations in HIV burden by geographical boundary | |
| a. HIV prevalence | Coverage mapping, confidence intervals, and interpolation |
| b. HIV positivity | Coverage mapping, confidence intervals, and interpolation |
| c. People living with HIV (PLHIV) | Coverage mapping |
| 2. Understand variations in HIV burden over time (trends over time | Mapping change and confidence intervals |
| 3. Understand ART coverage by geographical boundar | Coverage mapping |
| 4. Understand program coverage by geographical boundary | |
| a. ART service provision sites | Working with x,y data and proximity analysis |
| b. HIV testing sites | Working with x,y data and proximity analysis |
| c. Clinical monitoring sites | Working with x,y data and proximity analysis |
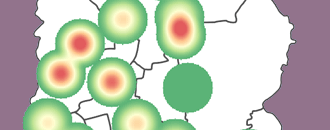
| 5. Identify potential HIV hotspots (areas where HIV transmission may be high/low) | Density mapping |
| 6. Identify any potential clustering | |
| a. Key population group | Density mapping |
| b. HIV case | Density mapping |
| c. Sites where key population groups congregate | Density mapping, proximity analysis |
| 7. Predict where more PLHIV are located | Interpolation |