GeoHealth Mapping GIS Training
for Monitoring and Evaluation or
Strategic Information Officers and Data Analysts for HIV

1.1. Using GIS for HIV Decision Making
"… without information, things are done arbitrarily and one becomes unsure of whether a policy or program will fail or succeed. If we allow our policies to be guided by empirical facts and data, there will be a noticeable change in the impact of what we do." — Nigerian policymaker, MEASURE Evaluation
Many public health professionals are overwhelmed with the collection and use of data related to the services they deliver. In some contexts, data requirements from governments and donors have grown exponentially, to the point where some service providers and implementing partners have pages and pages of forms to complete on a daily basis.
Rarely are these data used to monitor programs and make decisions beyond individual patient care. This is a lost opportunity because data are critical to program improvement and the decision-making process. It also becomes difficult to identify important patterns in health data, which has great implications for program planning and resource allocation. There is therefore a need for technology that can facilitate data use and help us understand such variations in space and time.
Geographic Information Systems (GIS) are one such technology quickly gaining ground as a powerful tool for evidence-based decision making for policy and planning in many sectors, including health. Maps are now a commonly used media for visualizing and interpreting patterns in health data.
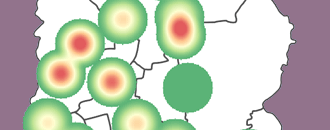
As HIV epidemics grow and change, geospatial analysis has allowed epidemiologists to develop a clearer picture of HIV. Scientists have long understood that HIV does not emerge in populations uniformly. Now, using GIS software, they have the ability to visualize with increasing precision where HIV infections are concentrated, giving them a greater understanding of how to drive down rates of infection. Because HIV exists in hot spots—pockets of higher transmission and infection rates—controlling the epidemic will involve targeting the specific geographic areas and marginalized populations most affected by the disease.