
GeoHealth Mapping GIS Training
for Monitoring and Evaluation or
Strategic Information Officers and Data Analysts for HIV

2.5. Introduction to Pivot Tables
Facility-level health data are often captured and stored in paper registers, which are occasionally computerized and stored in tables (either in Excel or in a database). To analyze these data, it may be necessary to summarize or aggregate the information up to a particular level of interest. For example, you may have service data at the city level, but wish to look at trends by province. You would then aggregate these data up to the provincial level. Once the data are aggregated, they can be uploaded and mapped.
A pivot table is a specialized type of query function that allows you to quickly aggregate your data by grouping it by a particular variable of interest. With pivot tables, you can do the following:
- Quickly summarize data from a worksheet or from an external source
- Calculate totals, averages, counts, etc., based on any numeric fields in your table
- Generate charts from your pivot tables
Pivot table reports can help quickly analyze numerical data and examine various research questions. For example, if you were examining data on condom distribution by organization, you could use pivot tables to answer the following questions:
- Who distributed more condoms?
- What is the average number of condoms distributed per district?
- How many reporting units are under each implementing organization?
- How many condoms were distributed by implementing partners?
In this example, we will aggregate survey records for each country.
2.5.1 Objectives
- Learn basic skills for using pivot tables
You will need the files for Section_2_5 to complete this module.
2.5.2 Creating a basic pivot table
- Open the Excel file "HIV National MIS Data Reporting Period July—December 2013."
- On the upper right, Insert > Pivot Table.
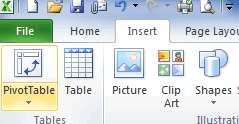
- The following screen will pop up:
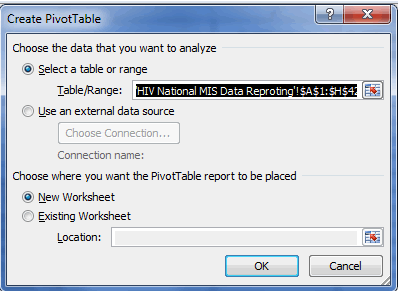
- Confirm the table range with respect to your data. Click OK.
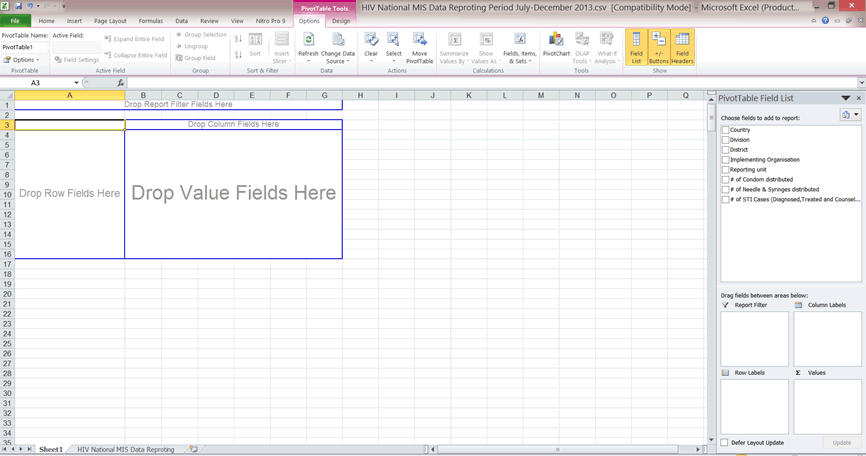
- We would like to know the total number of condoms distributed by each of the implementing partners.
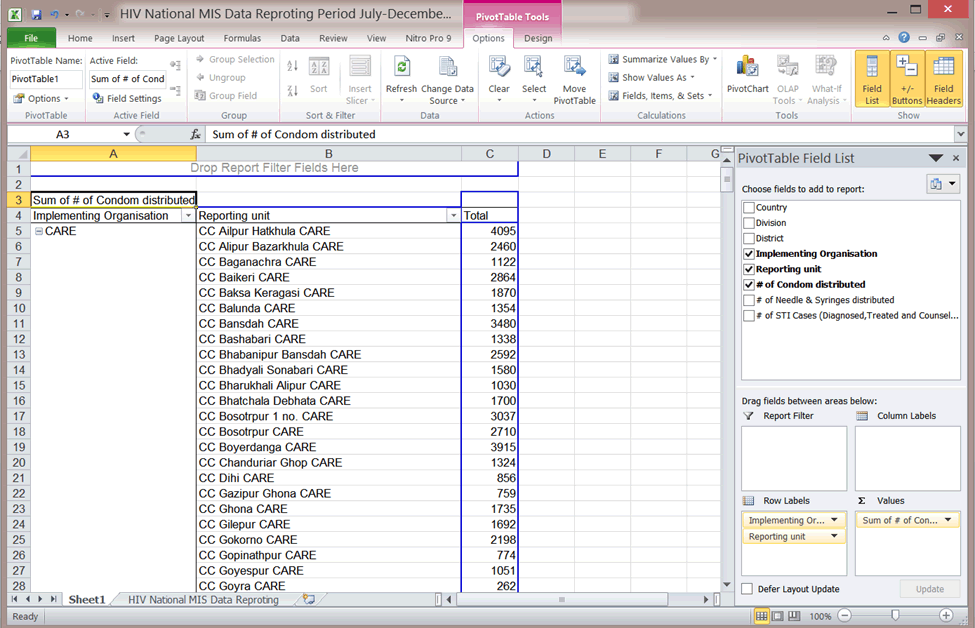
- In the pivot table field list select Implementing Organization and Reporting unit. These will appear in the Row Labels.
- Next drag and drop # of Condoms distributed into the Values section.
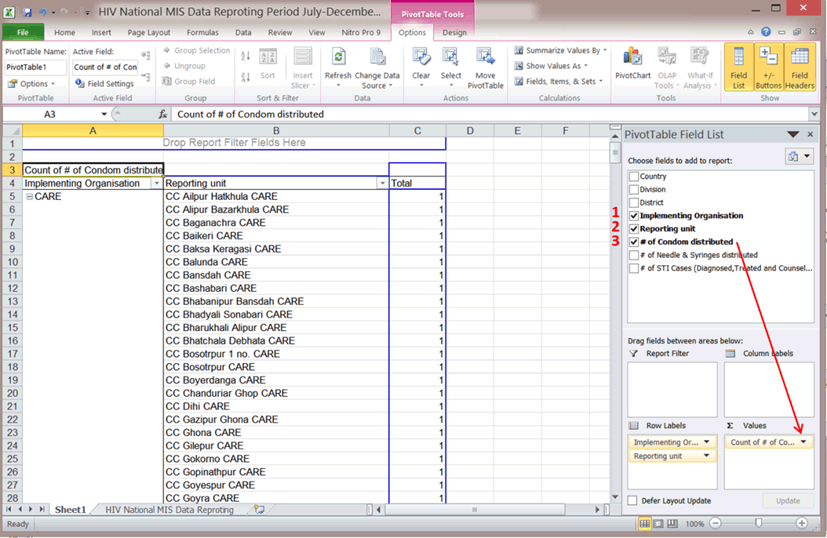
- You will notice the Total field does not give us the total sum of condoms distributed. You will need to change the value settings.
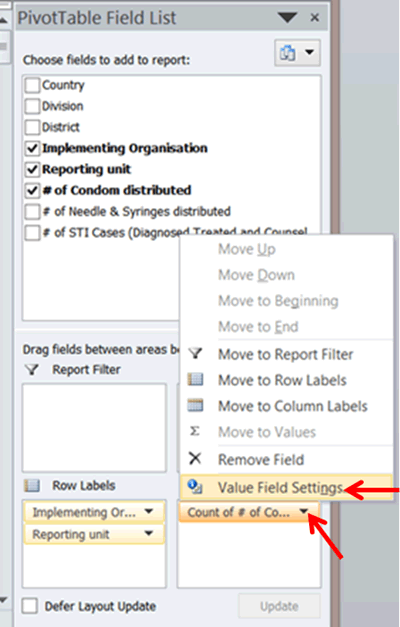
- Click on Count # of Condoms distributed in the Values section to open up a context menu.
- Select Value Field Settings.
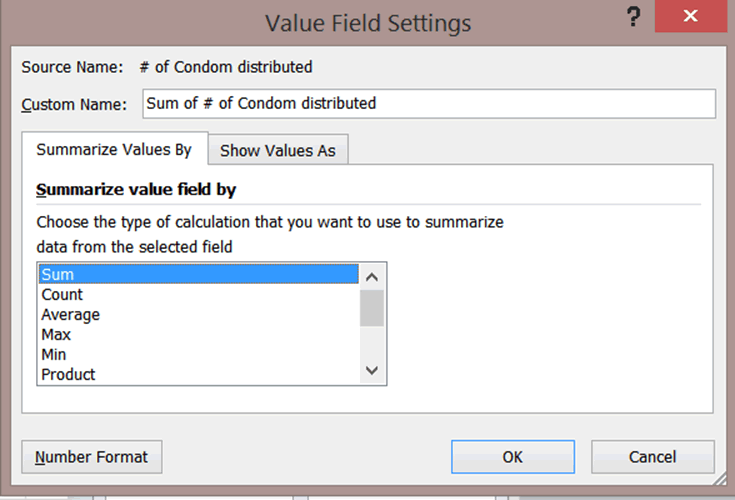
- Select Sum as the type of calculation you want to use to summarize the data. Click OK.
- The resulting table shows the distribution of condoms by different units of implementing partners.
2.5.3 Practice exercises
- Who distributed more condoms?
- What was the average number of needles and syringes distributed per district?
Hint: change the Values from # of Condoms distributed to # Needles & Syringes distributed. Refer to steps 9 – 11 to change the value field settings to Average. - What was the highest number of STI reported cases?