GeoHealth Mapping GIS Training
for Monitoring and Evaluation or
Strategic Information Officers and Data Analysts for HIV

3.2. Working with X,Y Coordinate Data
3.2.1 Background
Geographic locations are sometimes collected and stored in tables as X,Y coordinates. This section demonstrates how to import X,Y coordinate data on health facilities into QGIS and prepare a map of service coverage.
3.2.2 Objectives
- Add X,Y coordinate data
- Change coordinate systems
- Perform spatial joins with summary statistics
- Dissolve data
You will need the files for Section_3_2 to complete this module.
You have been asked to provide a summary of health facilities per district that offer HIV services. You have a list of health facilities with their X,Y coordinates in Excel, but no information regarding the district, province, or sector to which they belong.
3.2.3 Add X,Y coordinate data
- In your Exercise_Data folder, open the file Health_Facilities.xlsx.
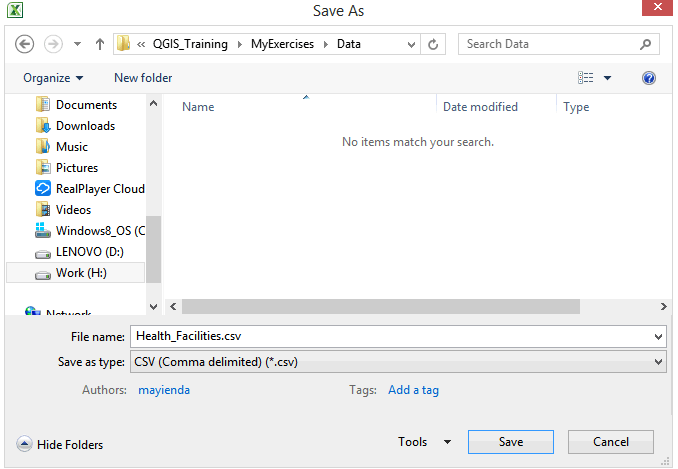
- Save it as a CSV file in the MyExercises\Data folder under the same name.
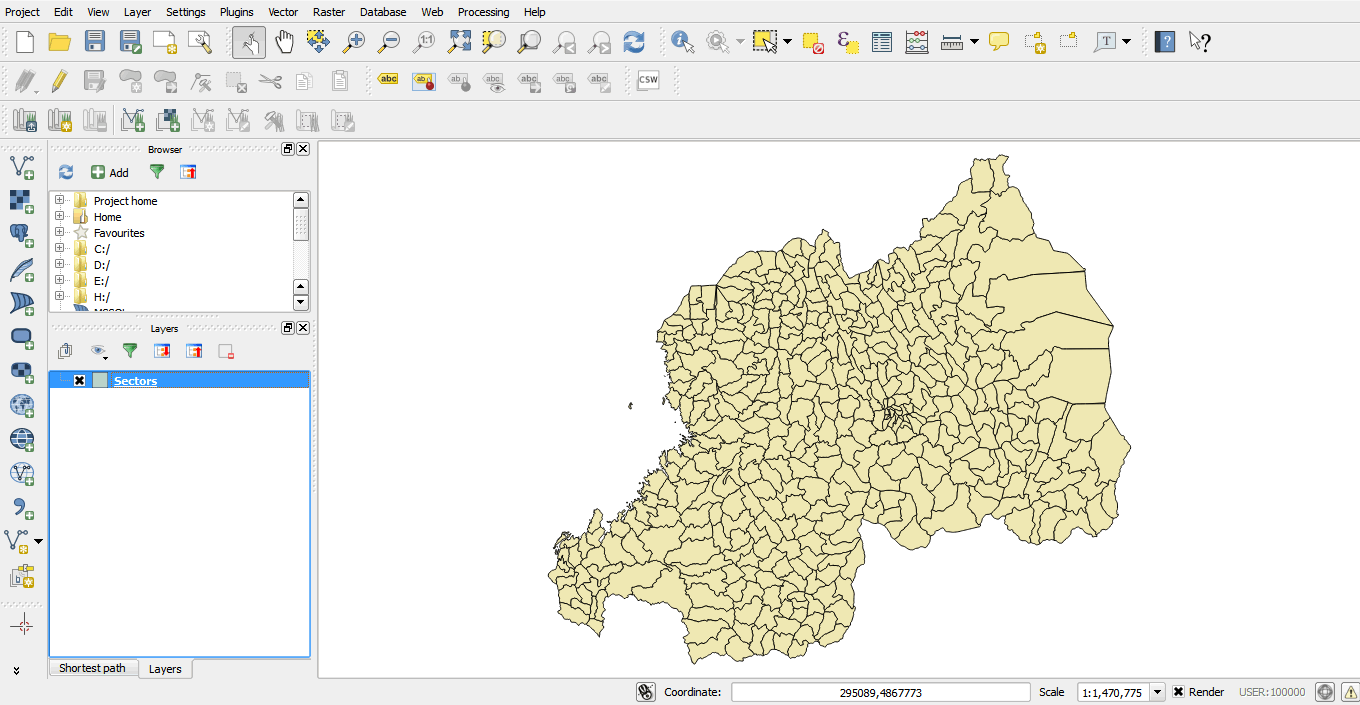
- Launch QGIS and open
 Exercise_3b.qgs: .
 - This opens a map of Rwanda sectors.
- Next, add the .csv file you created in step 2 above.
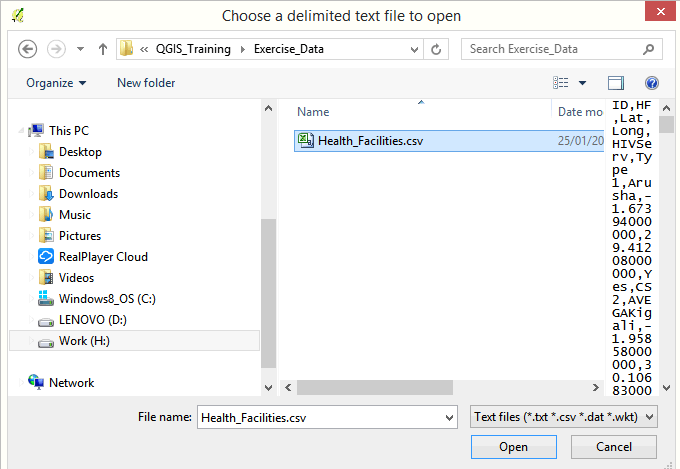
- On the QGIS main menu, click on Layer > Add Layer > Add Delimited Text Layer.
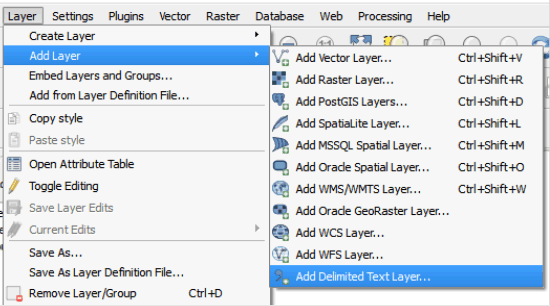
- In the dialog box that opens, browse to your folder and select the CSV file you created in step 2 above (Health_Facilities.csv) and click Open.
- This data has X,Y coordinates, so we will use the geometry definition options.
- In the Geometry definition, select Long for the X field and Lat for the Y field; click OK.
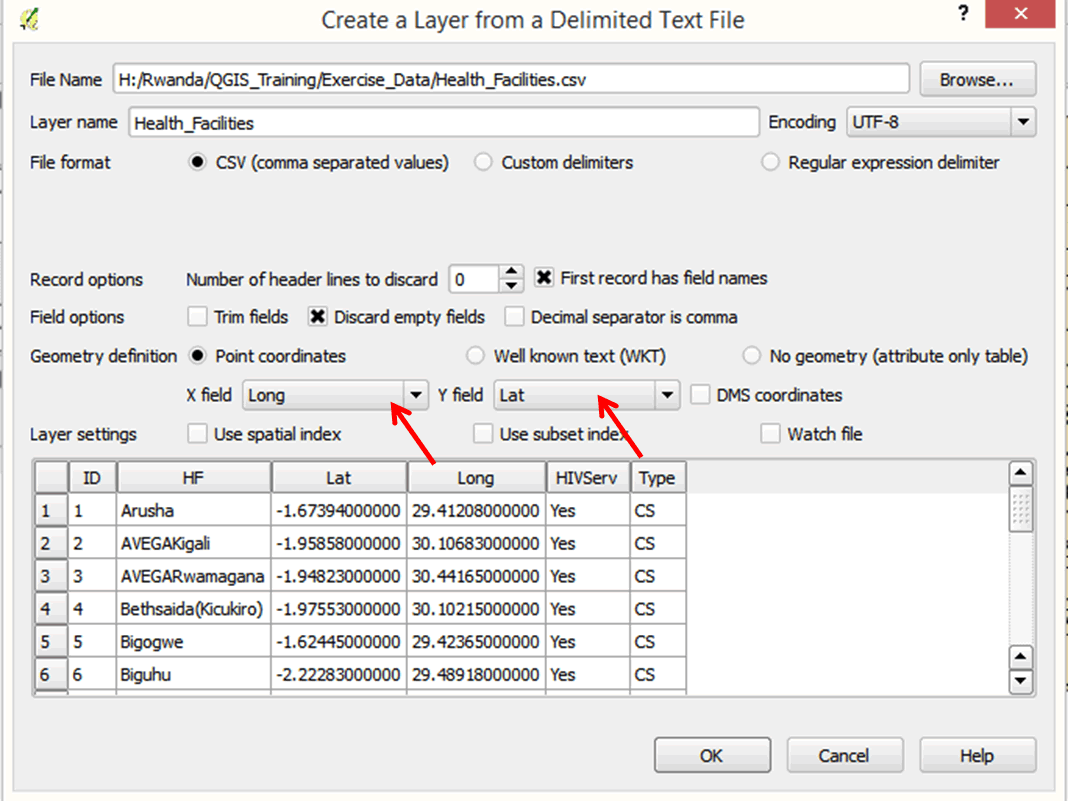
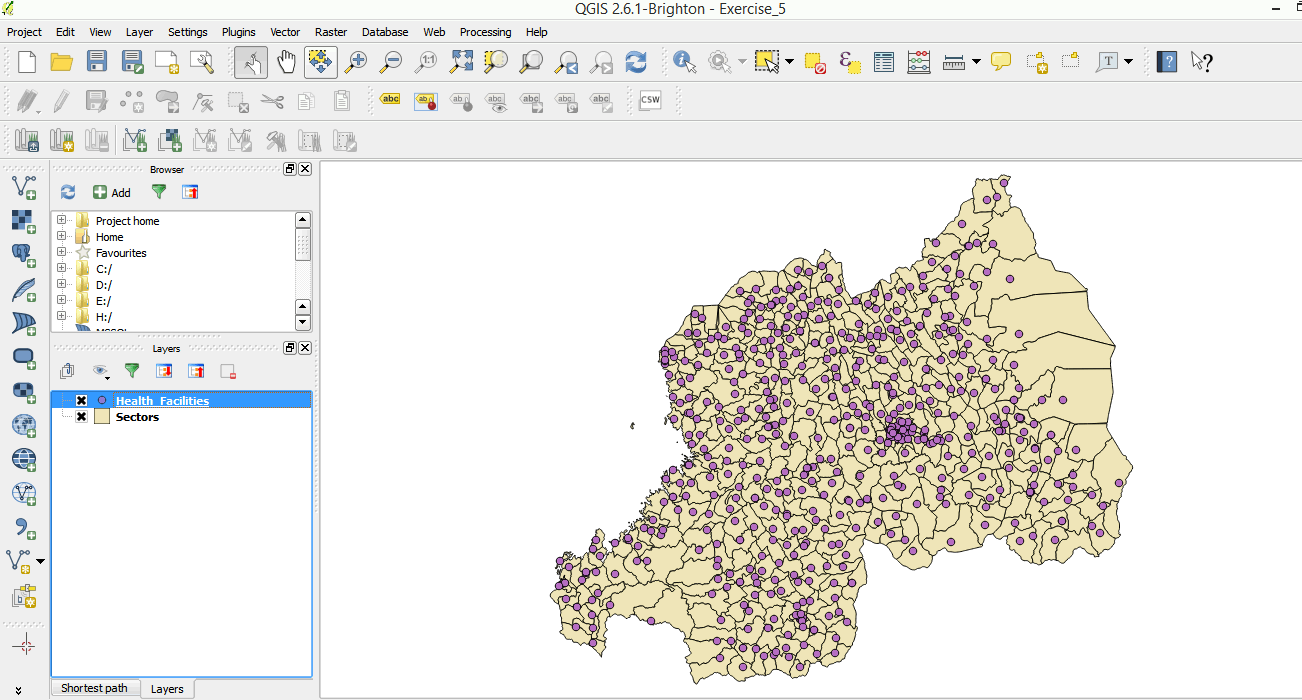
- The health facilities are added to the map.
- This is, however, a temporary file. We will save it as a shapefile.
- Right-click on the Health_Facilities layer and select Save As.
- Browse to the MyExercises\Data folder and save it there as Health_Facilities.shp.
3.2.4 Change the CRS (coordinate reference system)
- The shapefiles we have for Rwanda are in meters in a custom coordinate reference system. The file of X,Y coordinates is in decimal degrees. We have to save our file in the same coordinate system as the rest of the files.
- In the dialog box, click on the pull-down menu for CRS.
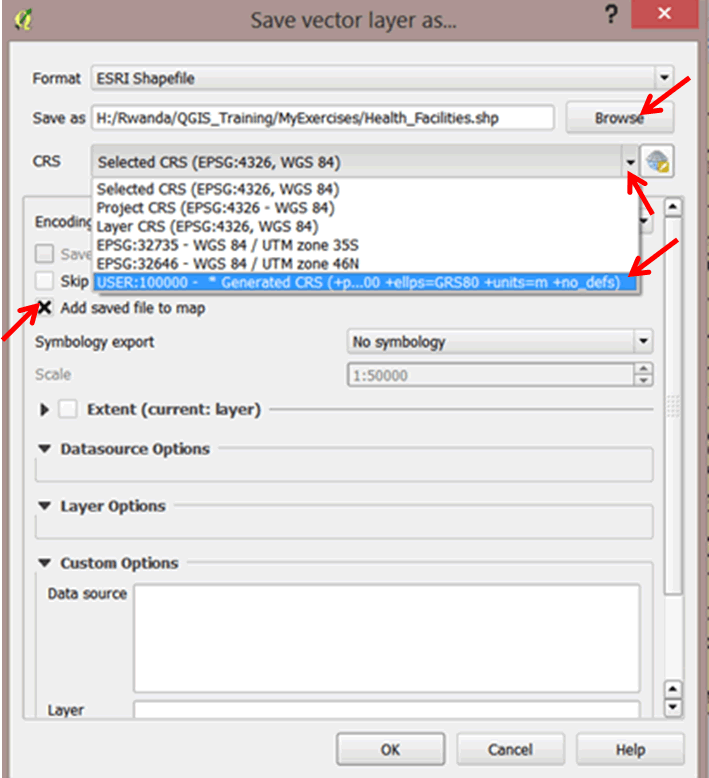
- Select Project CRS, which is the custom CRS for Rwanda.
- Ensure that the Add saved file to map option is selected in the next dialog box.
- Click OK.
- The new shapefile has been added to the map.
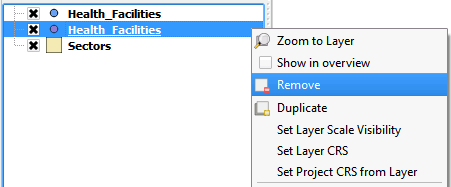
- Remove the temporary Health_Facilities layer by right-clicking on it and selecting Remove. The temporary layer is directly below the new file.
- Right-click on the Health_Facilities layer to open the attribute table. You will notice that it is a list of health facilities, but we have no way of telling which districts they fall in just by looking at the table. In this exercise, our aim is to provide a summary of health facilities per district using GIS tools. To solve this problem, we will perform a spatial join, which is a way of transferring attributes from one layer to another based on their spatial relationship (i.e., where they can be found).
3.2.5 Spatial join
A spatial join is a GIS operation that appends data from one feature layer's attribute table to another layer based on the location (spatial relationship). The next steps will demonstrate how to update the health facilities layers with attributes from the sectors layer.
- Click on Health_Facilities in your layer list to highlight.
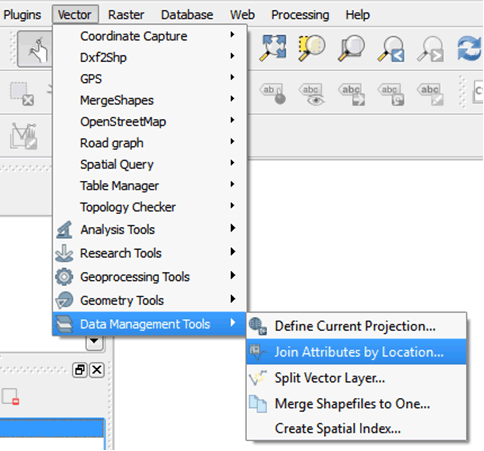
- On the main menu, go to Vector > Data Management > Join Attributes by Location.

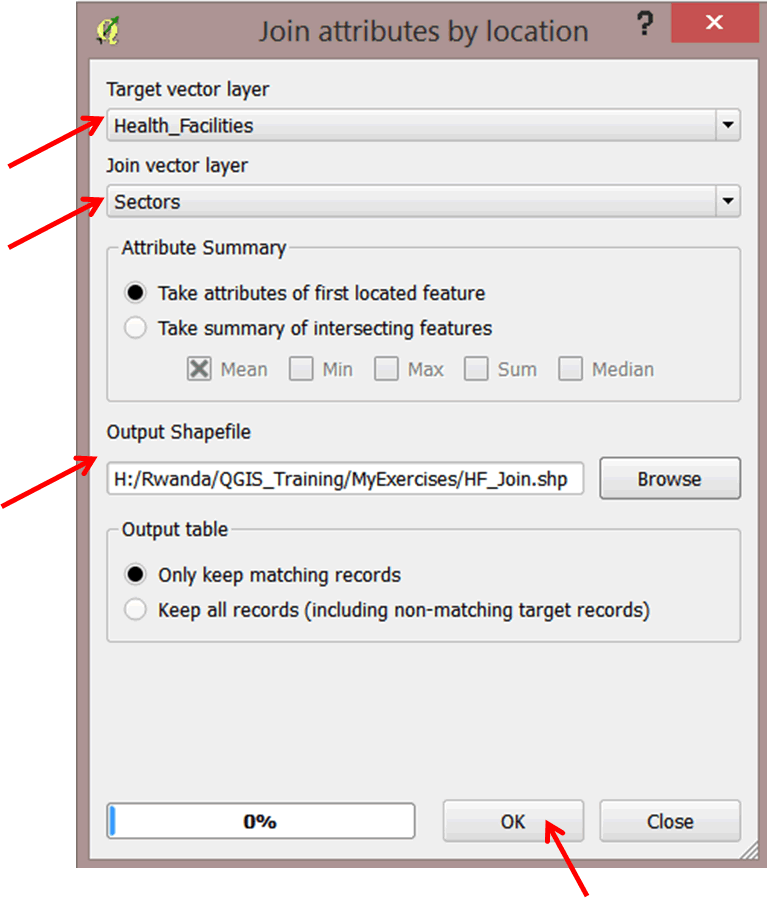
- In the dialog box, your Target vector layer should be Health_Facilities (we want to transfer attributes to this layer).
- Select Sectors for the Join vector layer (we want to transfer attributes from this layer).
- Browse to your exercise data folder and save the file as HF_Join.shp. Click OK.
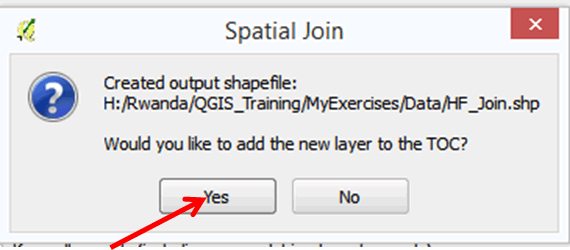
- Click Yes on the next dialog box to add the new layer to the table of contents.
- Close the join attributes dialog box.
- HF_Join layer is now added to your map.
- Open the attribute table and scroll to the right. New fields for district, province, and sector have been added to the table.
3.2.6 Dissolve data
Dissolve is a GIS operation that combines (merges) polygons based on a common attribute. For example, if you have a file at a lower level of administration (like districts), you can dissolve (merge) the districts into their respective provinces. This creates a new layer file of provinces.
- Our task was to determine how many facilities are in each district. However, we have been provided with a layer of sectors. We will create a new layer of districts by dissolving (merging) the sectors into their respective districts.
- Turn off the HF_Join and Health_Facilities layers.
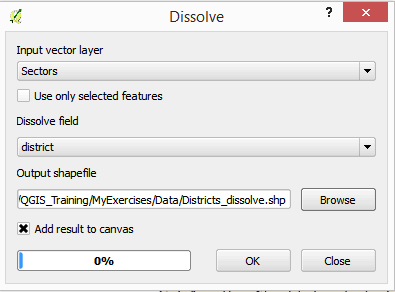
- On the main menu, go to Vector > Geoprocessing Tools > Dissolve.
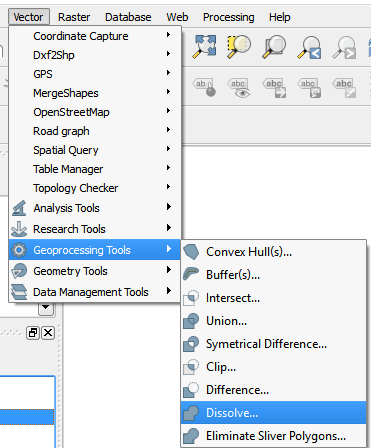
- Ensure your Input vector layer is Sectors.
- For the Dissolve field, select district from the pull-down menu.
- Browse and save the file in your exercise data folder as Districts_dissolve.shp.
- Click OK.
- The new layer has been added to your map. Close the dissolve dialog box.
- Turn your new layer off, and then on, to see the difference.
- Open the attribute table of the new layer and scroll through it. How many districts do we have?
3.2.7 Spatial join with summary statistics
In order to summarize the number of health facilities per district, we must carry out a spatial join with summary statistics. This will sum the number of health facilities and add that to our Districts_dissolve layer.
- Turn on the HF_Join layer.
- On the main menu, go to Vector > Data Management > Join Attributes by Location.
- In the Join attributes by location dialog box, select Districts_dissolve as the Target vector layer.
- Select HF_Join as the Join vector layer.
- In the Attribute Summary, several options are given for summary statistics. Click on the box next to Mean to deselect it, and click next to Sum to select. We want the tool to sum up the number of facilities per district.
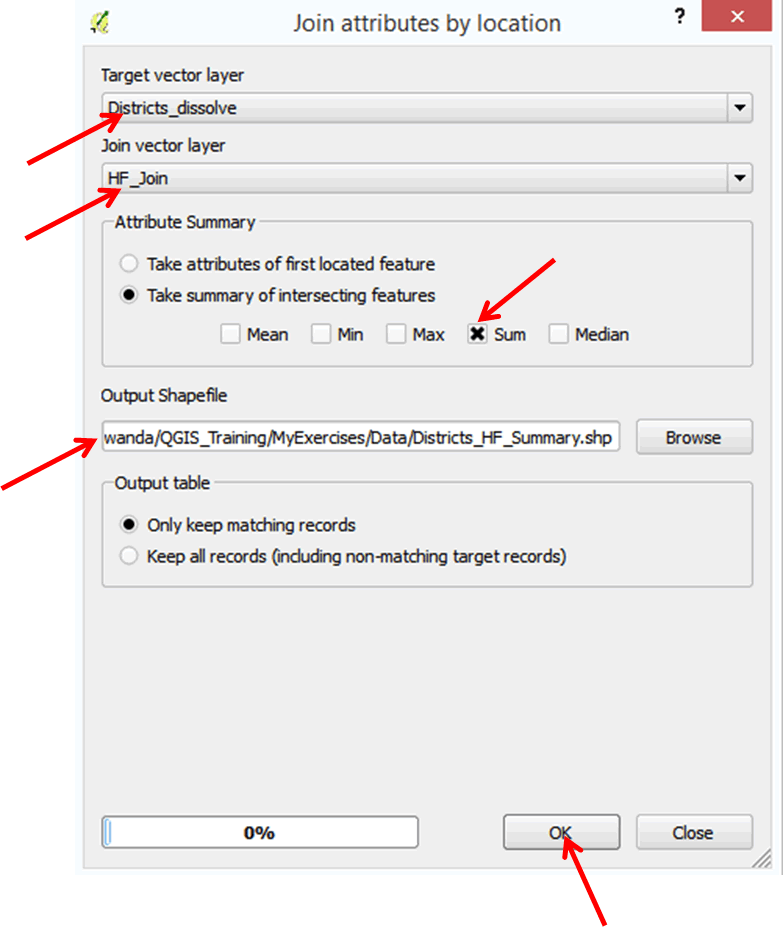
- Browse to your exercise data folder and save the file as Districts_HF_Summary.shp.
- Click OK. Click Yes at the next dialog box to add the new layer to your map document.
- Turn off HF_Join layer.
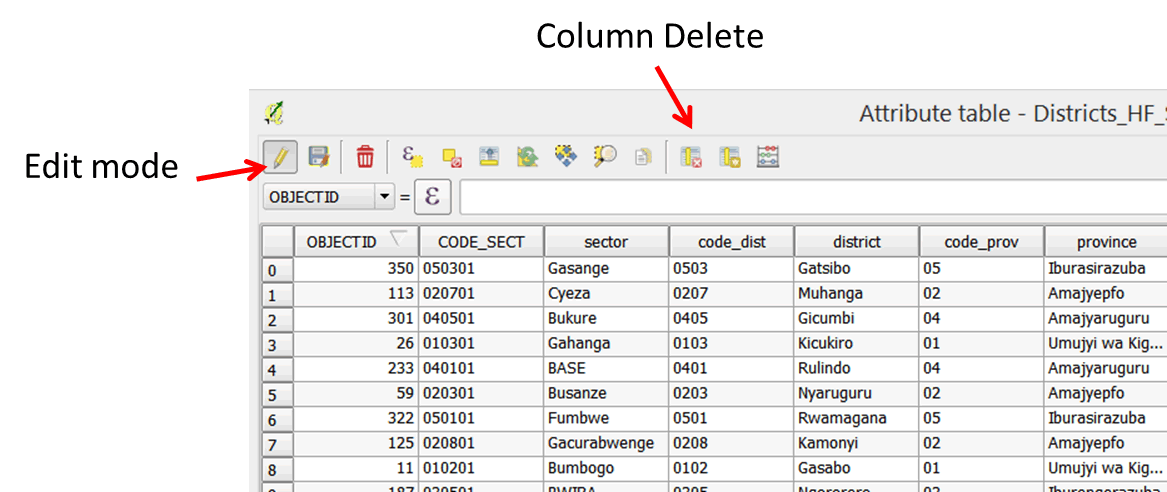
- Open the attribute table of the Districts_HF_Summary layer and scroll to the right. There will be a new column, "Count," which has the total number of facilities counted per district.
- Our table has a lot of unnecessary fields, so we will clean it up.
- Click the toggle edit mode button on the toolbar, then click on the column delete button (refer to graphic below).
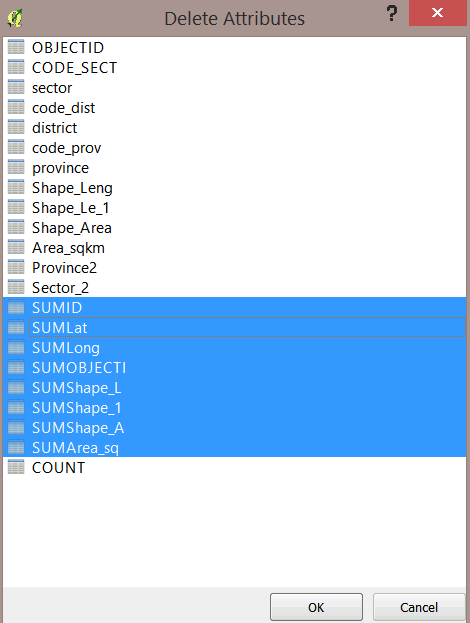
- In the Delete Attributes dialog box, select the following columns to delete: SUMID, SUMLat, SUMLong, SUMOBJECTI, SUMShape_L, SUMShape_1, SUMShape_A, and SUMArea_sq.
- Click OK when done.
- Save your edits and exit edit mode.
- Close the attribute table.
- Save your project in the MyExercises folder.
Practice exercises
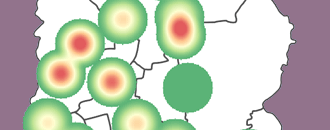
- Create a choropleth of HIV service coverage at the district level.
- Hint: double-click on Districts HF Summary and select style in the layer properties.
- Change to Graduated Symbol and select Count as your column field.
- Create a map layout and export your map.
- Create a PowerPoint presentation of your findings.
- Create a choropleth map of health facility distribution by province.
- Hint: Repeat steps 34–60. Dissolve the sectors by province.