GeoHealth Mapping GIS Training
for Monitoring and Evaluation or
Strategic Information Officers and Data Analysts for HIV

4.3. Creating New Vector Datasets
In our previous exercises, we worked with existing datasets that had to be created previously. In this exercise, we will learn how to create vector datasets using a raster image from Google Earth.
4.3.1 Objectives
- Learn how to create new vector datasets
- Learn how to create new data (digitizing features)
- Add attributes
- Edit data
You will need the files for Section_4_3 to complete this module.
4.3.2 Create new vector datasets
- Launch QGIS and create a new project.
- Before adding new vector data, you need a vector dataset. We will begin by creating new datasets before adding new vector data to them.
4.3.3 Create a point vector dataset
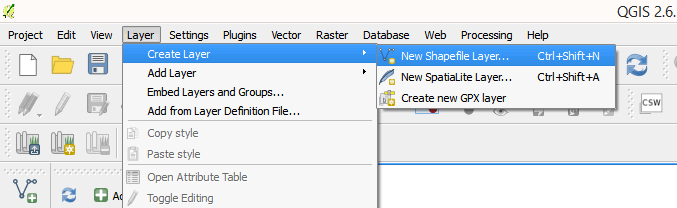
- On the main menu, click on Layer > Create Layer > New Shapefile Layer.
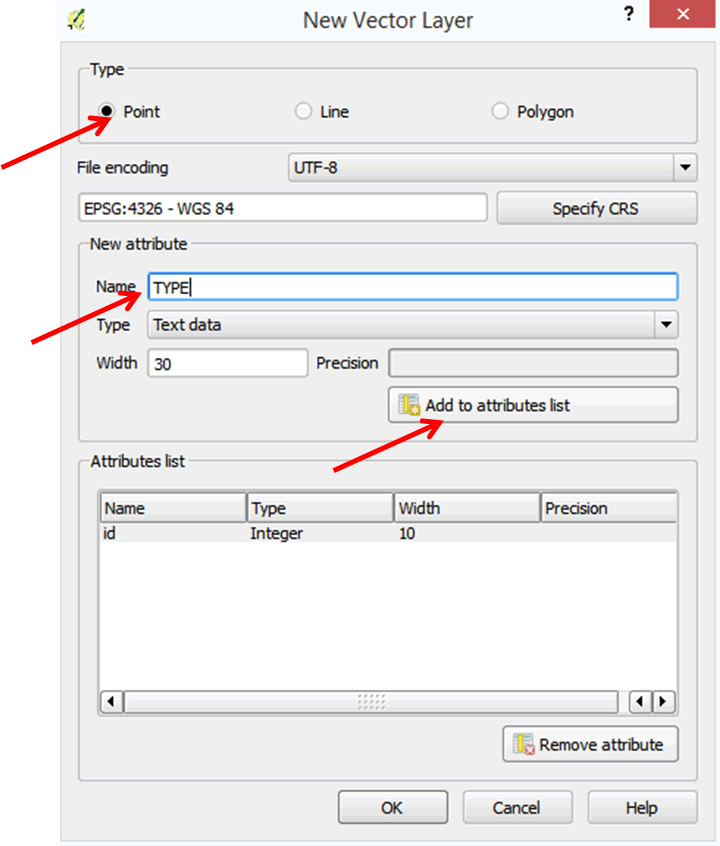
- Our first layer will be a point layer of sex worker hotspots, so in the New Vector Layer dialog box, select point as the Type.
- Leave the CRS box as the default of EPSG:4326 - WGS 84.
- We will now create a new attribute for adding data.
- Under New attribute enter TYPE in the Name box.
- We will store text values in this attribute, so leave the Type as Text data.
- Change the Width to 30. The text values we are going to store here are not very long and will not exceed 30 characters.
- Click Add to the attribute list.
- Add the following new attributes:
Name Type Width Category Text data 30 EstNumbers Whole number 10 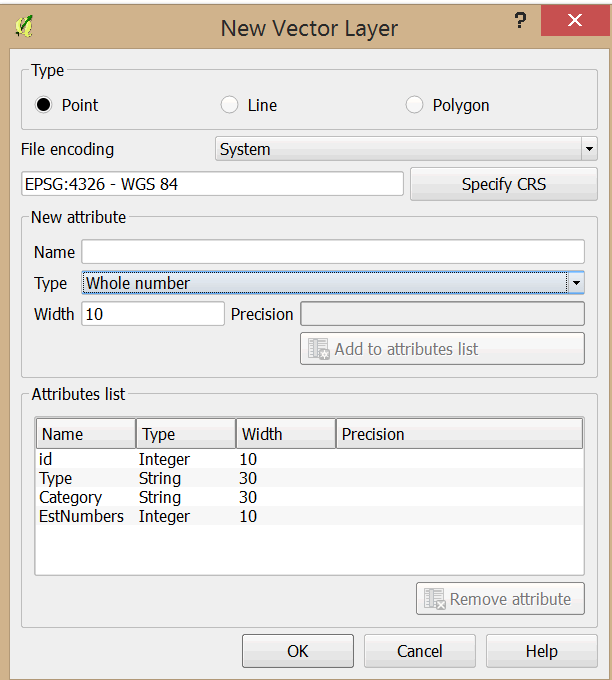
- Click OK. In the dialog box that opens, save the file in MyExercises as Hotspots.shp.
- Click Save. The file will be added to your layer list.
- You now have an empty dataset.
- Save your project in MyExercises as Exercise_6.
4.3.4 Add a raster layer
Our data source is a raster image obtained from Google Earth. We will digitize hotspots from this image.
- On the main menu, click on Layer > Add Layer > Add Raster Layer.
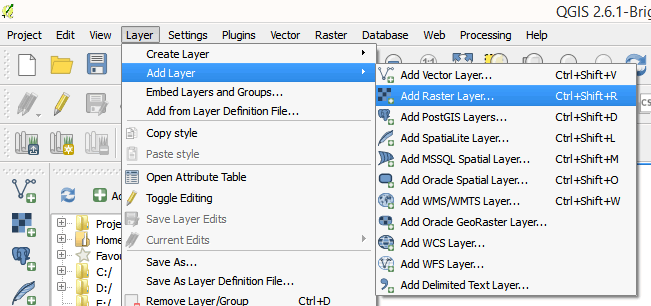
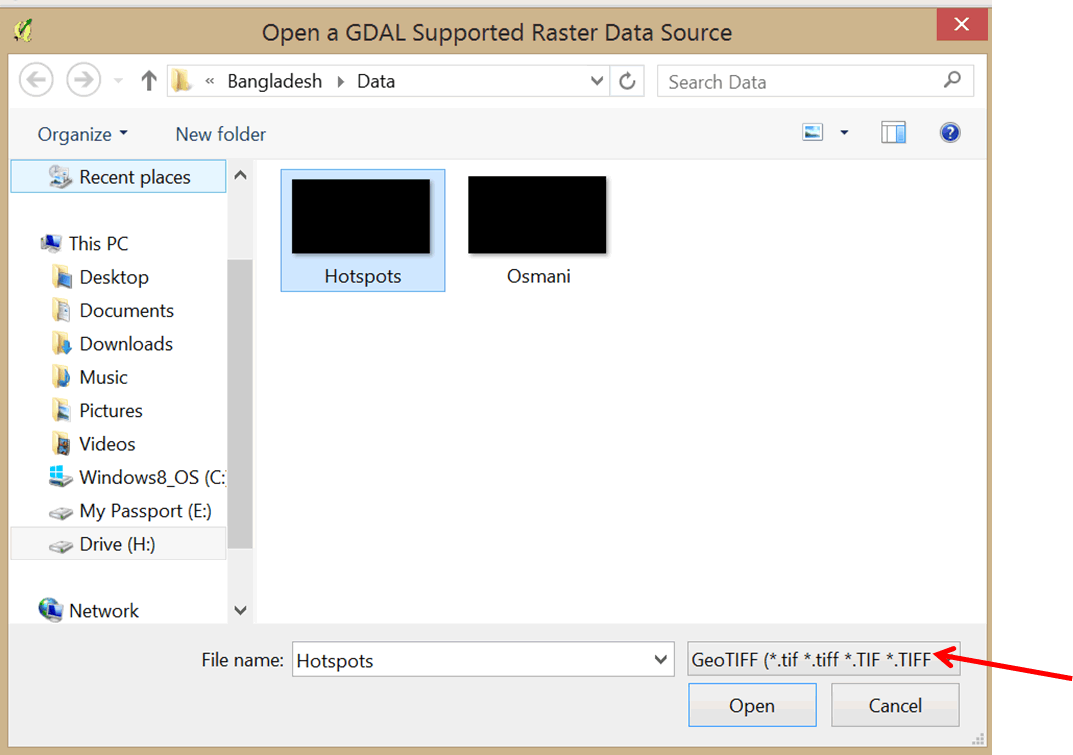
- Navigate to your Data folder. For file type, select GeoTIFF from the pull-down menu.
- Select Hotspots.tif and click Open.
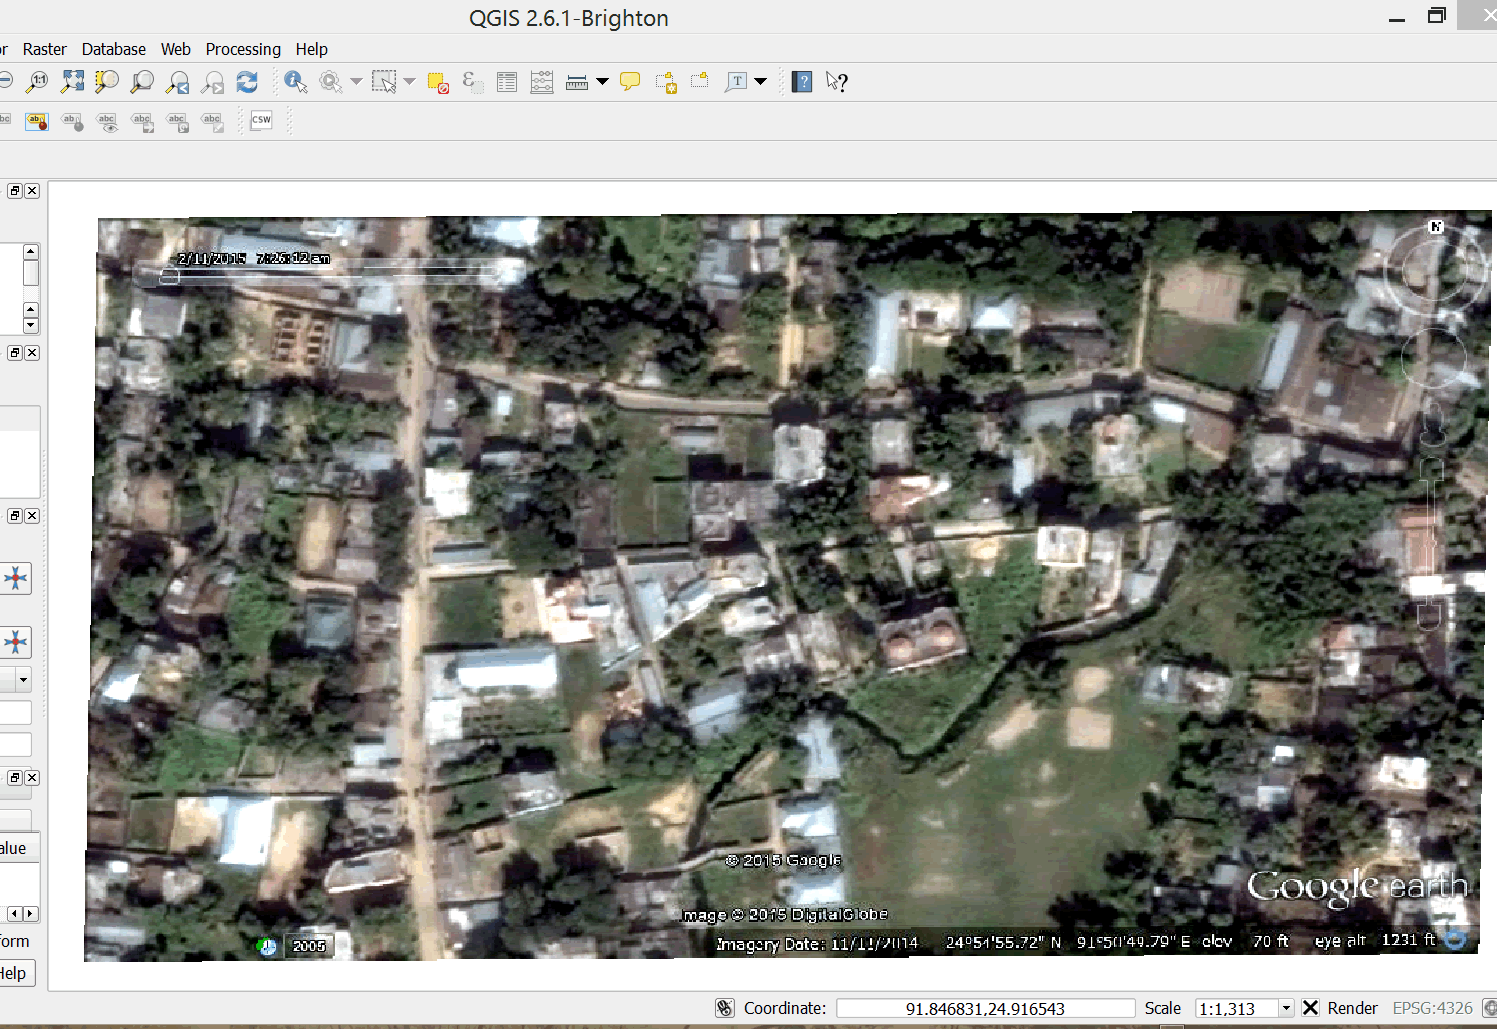
- The image has been added to your map. Drag it below the empty point file. Note the different icons for the layers despite the same name.
4.3.5 Digitize point data
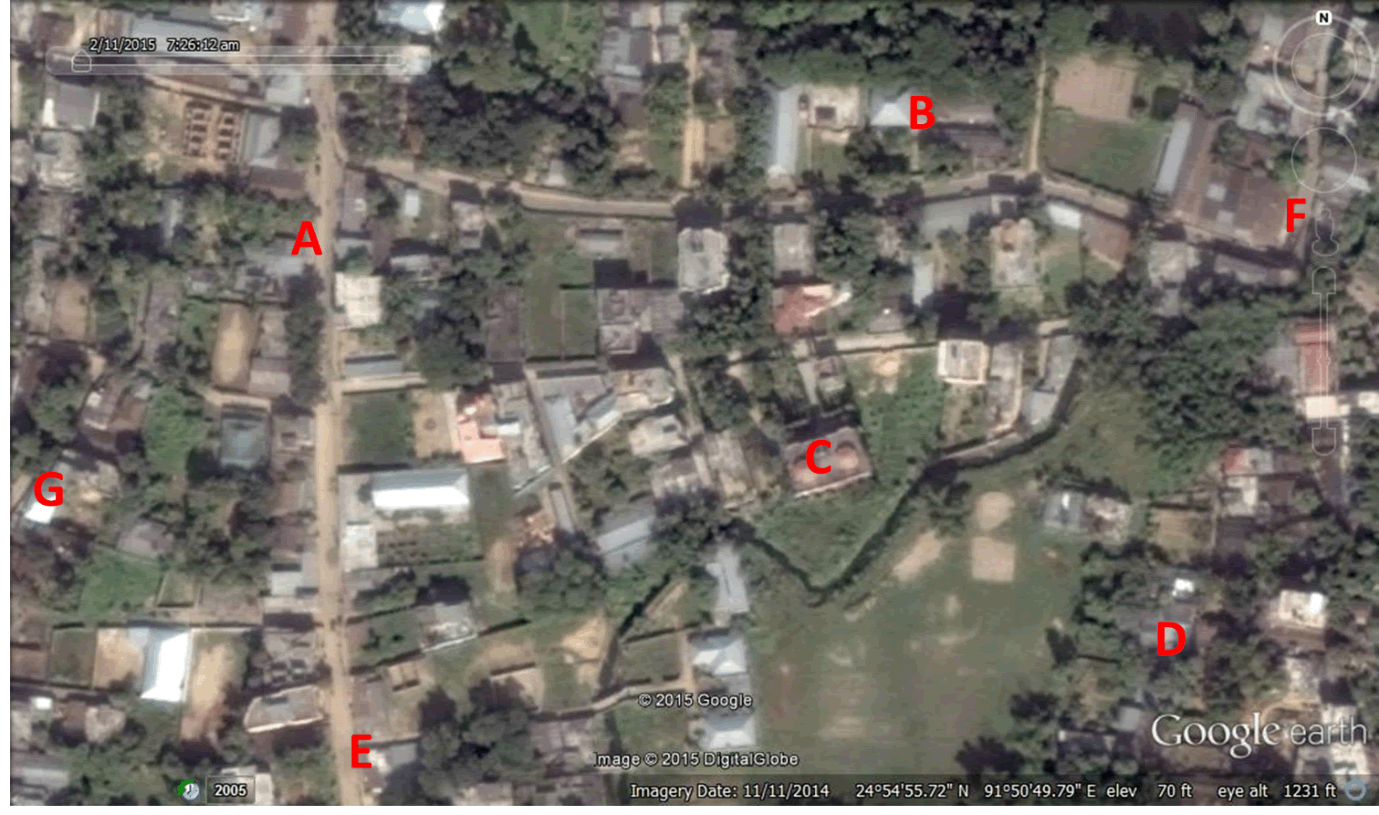
- We will digitize seven hotspots.
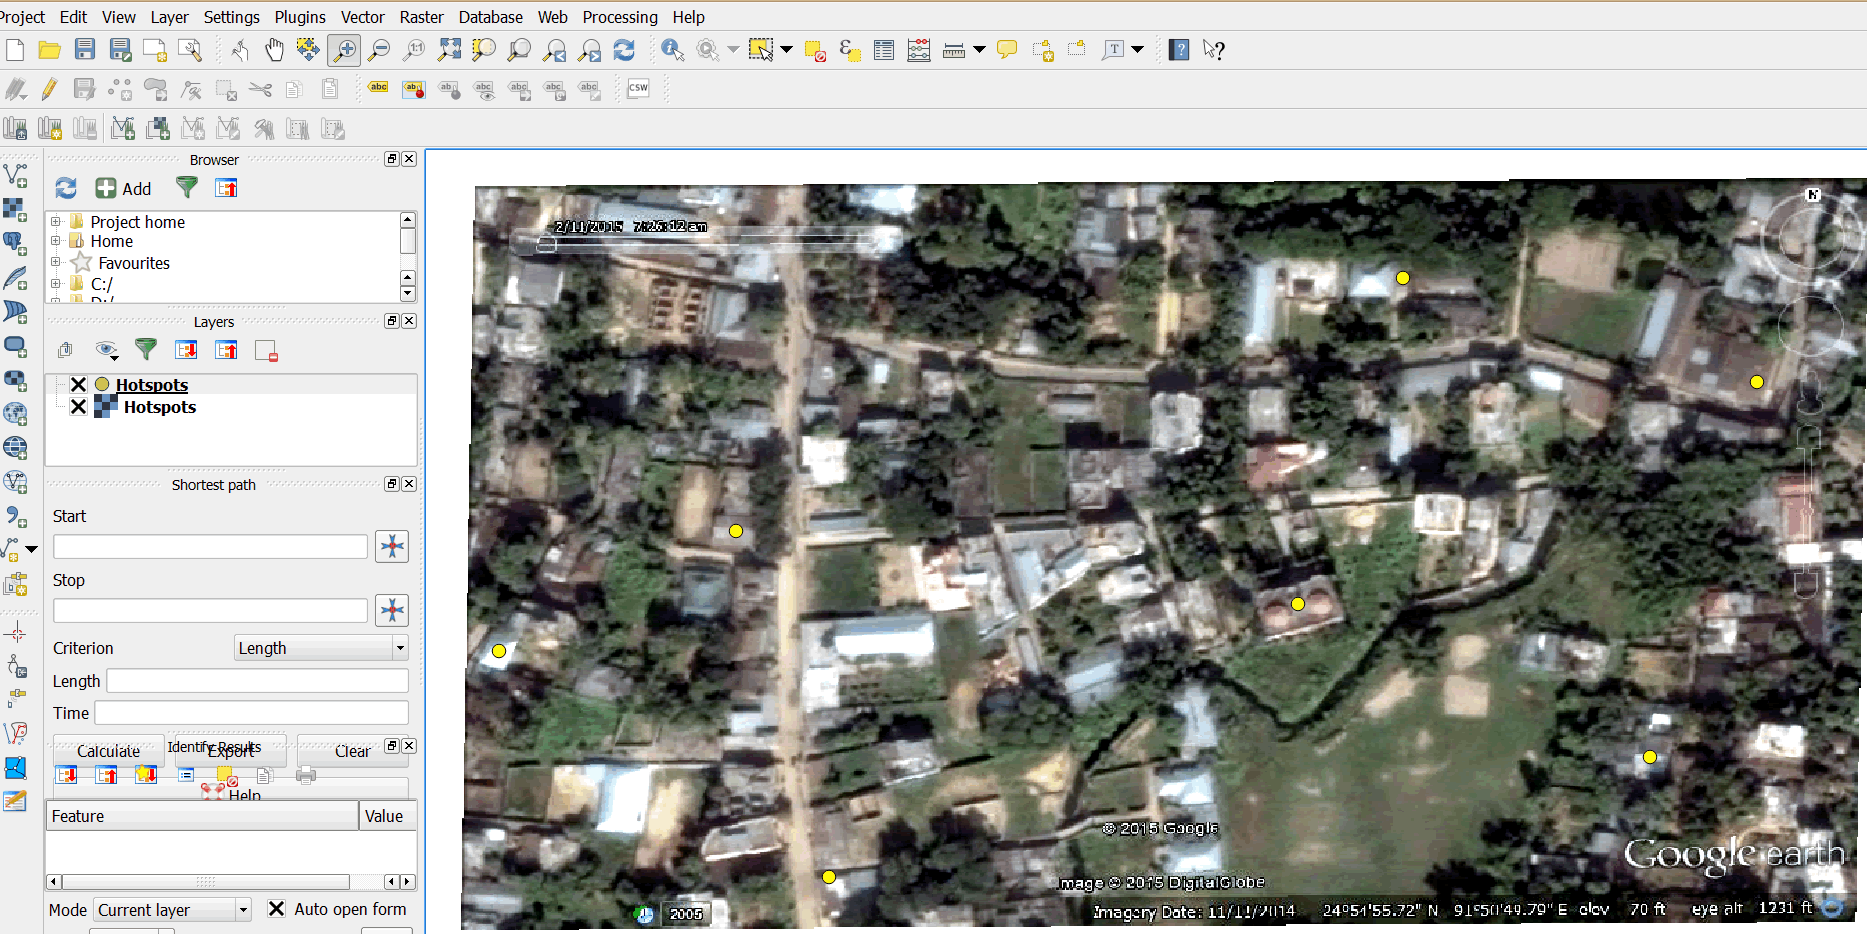
- Refer to the image below to locate the point marked A on your image in QGIS.
- To add data to our new empty layer Hotspots, the layer must be in edit mode.
- Right-click on Hotspots empty point layer and select Toggle Editing to set to edit mode.
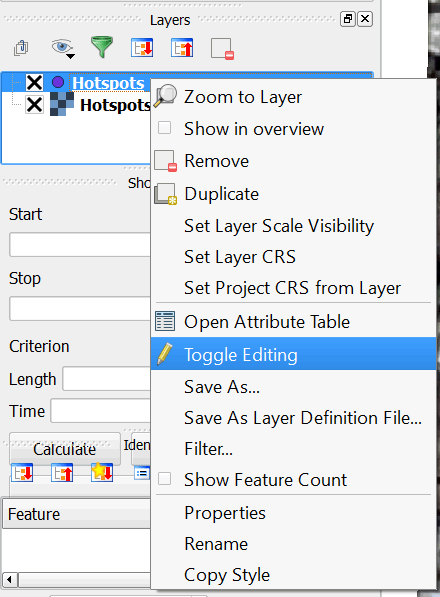
- Once you are in edit mode, the digitizing tools toolbar will become active.
- Click on the Add features button.
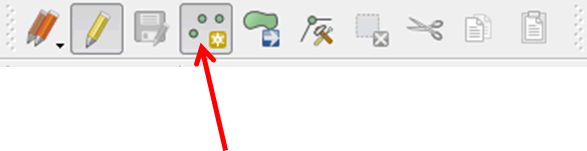
- Click on the location for point A on your image.
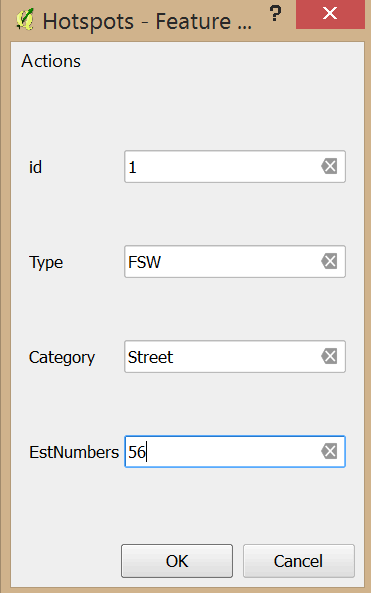
- The Feature Attributes dialog box opens up.
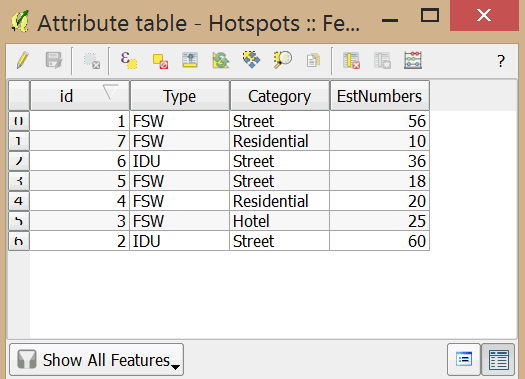
- Type 1 in the Id field and FSW in the Type field. In the Category field, type Street. In the EstNumber (estimated numbers), type 56. Click OK.
- A point has been added to your image. Let's change it to a bright yellow color so that it is visible.
- Double-click on the point file and change the color in the Layer Properties dialog box.
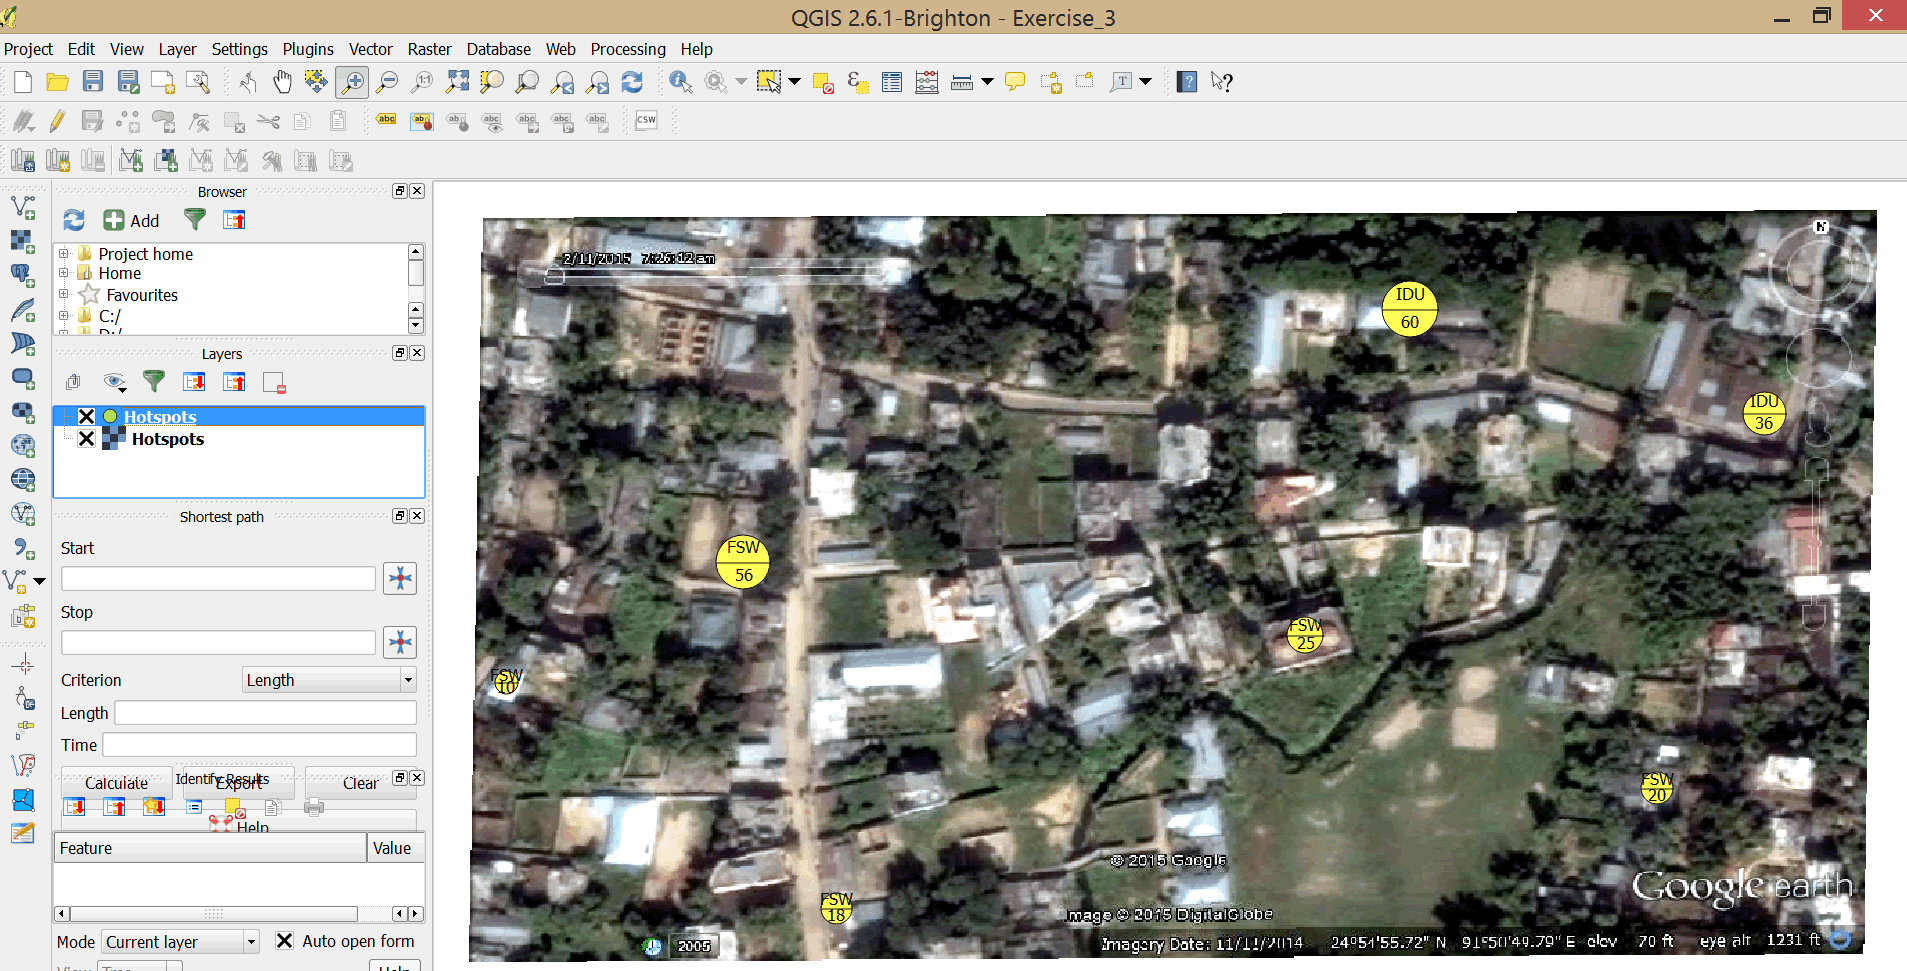
- Digitize the remaining six points and update their attributes as per the table below.
Point ID Type Category EstNumbers B 2 IDU Street 60 C 3 FSW Hotel 25 D 4 FSW Residential 20 E 5 FSW Street 18 F 6 IDU Street 36 G 7 FSW Residential 10 - Your map should resemble the graphic below.
- Right-click on the layer and open the Attribute table.
- We now have a dataset consisting of various hotspots.
- Close the attribute table.
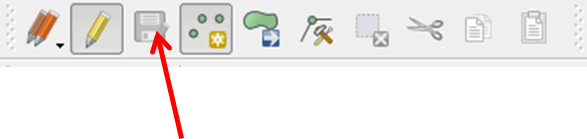
- Click on the Save layer edits button on the edits toolbar.
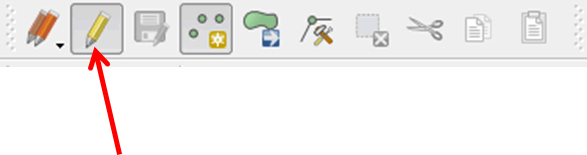
- Click on the Toggle editing button to exit edit mode.
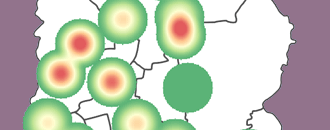
4.3.6 Symbolize hotspots using proportional symbols
Proportional symbols are a way of symbolizing point data to show the relative magnitude of a particular variable. We will map the relative magnitude of hotspot types.
- Double-click Hotspots layer to open the Layer Properties dialog box.
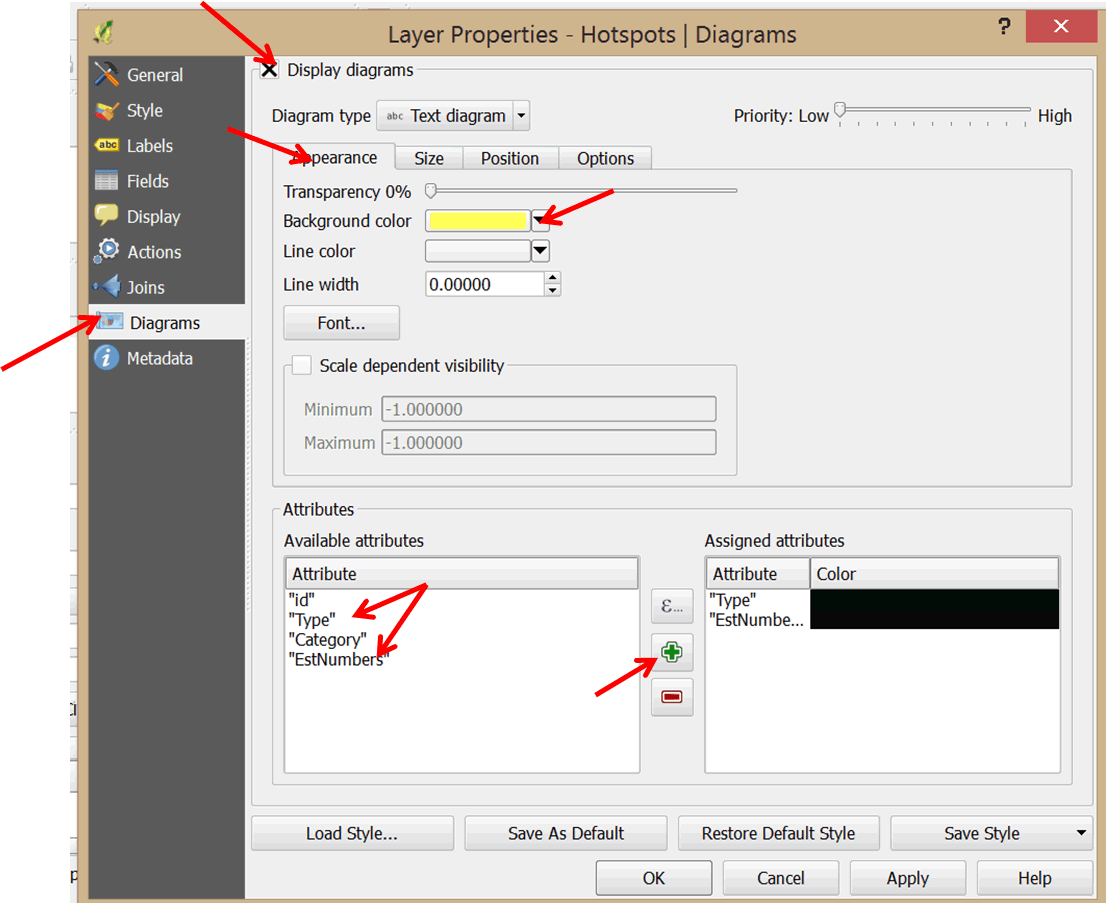
- In the left panel, select Diagrams.
- Select the Display diagrams button.
- For Diagram type, use the pull-down menu to select Text diagram.
- Click on the Background color pull-down menu and select a yellow color.
- In the Attributes section at the bottom of the dialog box, click on Type and click the green plus sign to add it to the Assigned attributes. Do the same for EstNumbers. Change the color to a dark color like black.
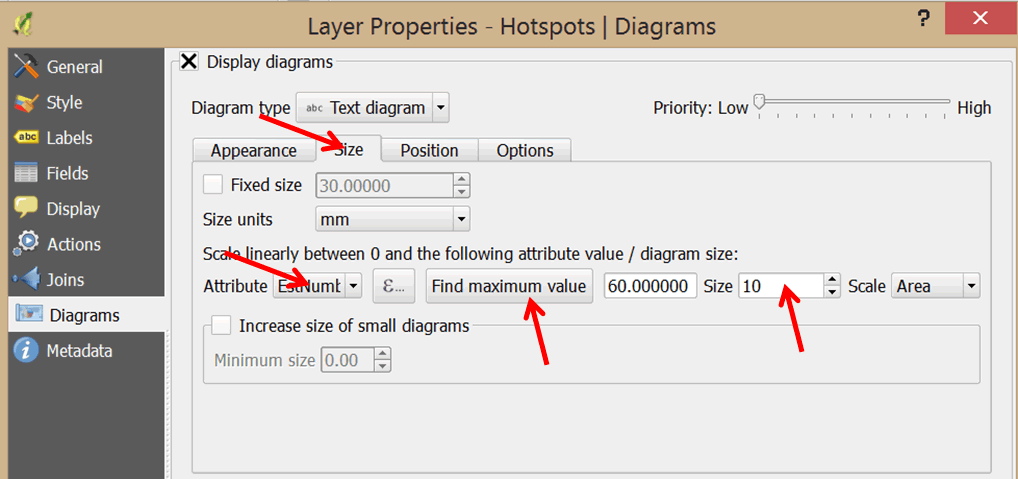
- Click on the Size tab and un-check the Fized size option.
- To select your scale attribute use the Attribute pull-down menu and select EstNumbers as the attribute to map using proportional symbols.
- Click on the Find maximum value button. In the box next to it, change the size to 10 or 9.
- Click on the Position tab and select Over point from the Placement pull-down menu.
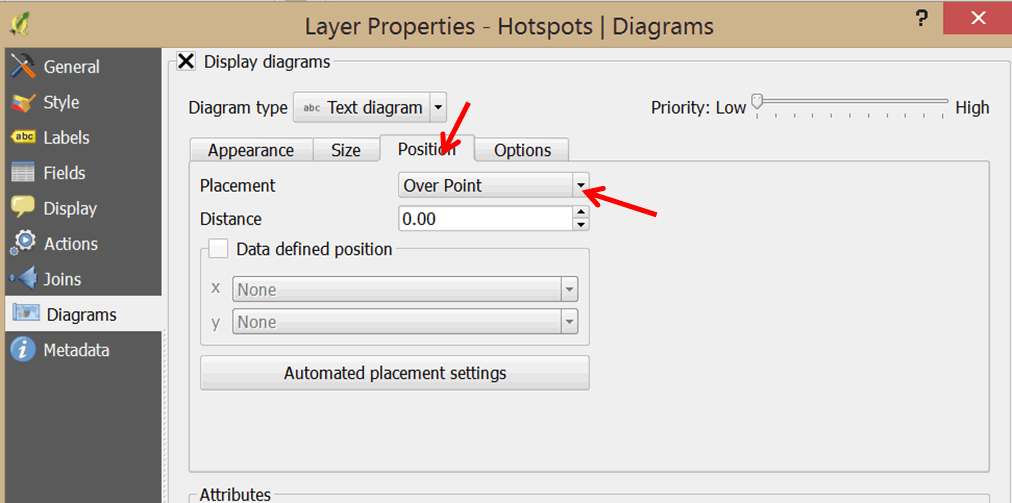
- Click OK.
- Your map should resemble the graphic below.